 Harami
means pregnant(in Japanese language).
Harami
means pregnant(in Japanese language).The harami candlestick chart pattern is a reversal candlestick pattern.
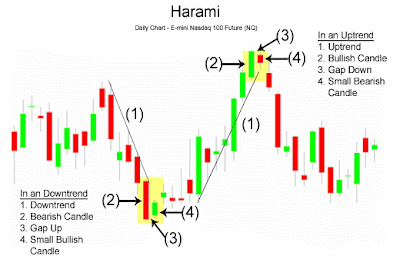
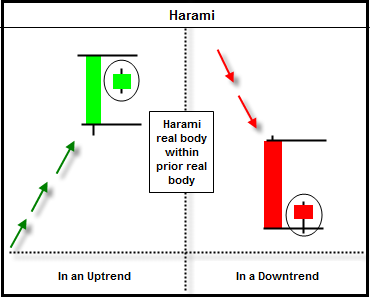
This pattern consists of two candlesticks and the first one contains the second one in its mid point. For this reason, it is called harami pattern.
When this pattern indicates as a bullish signal then it is called as a bullish harami candlestick chart pattern.
On the other hand, when it indicates as a bearish signal then it is called as a bearish harami candlestick chart pattern.
Direction:-- Bearish/Bullish
Type of this pattern: reversal
Reliability on this pattern: Week
There are two types of harami candlestick chart pattern. One is bullish and another is bearish.
A bullish harami candlestick chart pattern usually comes at the end of an exhausted down trend. The first candle will be bullish. The second candle will start with an gap up. It will be a bullish candle. The second candle indicates that price was unable to move up.
This pattern indicates uncertainty in the market.
After a bullish harami candlestick pattern formation, wait for a confirmation.
A good confirmation can be a bullish candle formation after the pattern. Wait for its completion.
See an example in a chart.........

| 01 | How to Read A Candlestick Chart |
| 02 | Bearish Engulfing |
| 03 | Bullish Engulfing |
| 04 | Doji |
| 05 | Dragonfly Doji & Gravestone Doji |
| 06 | Piercing Pattern |
| 07 | Morning star |
| 08 | Dark cloud cover |
| 09 | Hammer |
| 10 | Hanging Man |
| 11 | Harami |
| 12 | Inverted Hammer |
| 13 | Evening star |
| 14 | Shooting star |
| 15 | Tweezers Top |
| 16 | Tweezers Bottom |
| 17 | Windows |
| 16 | The Last Discussion on Japanese Candlestick Chart |


No comments :
Post a Comment