 The
ability to read a candlestick chart can bring enormous result in the
view of technical analysis.
The
ability to read a candlestick chart can bring enormous result in the
view of technical analysis.Because, It is the chart which is playing a significant role here to tell historical story about the market. That means, here the chart is working as an indicator.
Where your chart works as indicator, why you need to depend on some other fancy indicators !
To understand candlestick chart you need to know the basic of it and the most recurring candlestick chart patterns such as Doji, Engulfing, Morning and evening star etc.
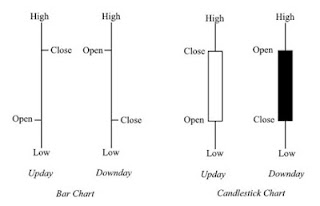
Difference between Candlestick Chart & Bar Chart
There are some well-known charts such as line chart, bar chart and candlestick chart. A candlestick chart can bring more data about the market condition than a bar chart.

See in real market........
 |
| Traditional Bar chart |
 |
| Same chart in the view of candlestick chart which is more clear! |
Candlestick chart patterns and its body show show significant historical data about the market apparently by which you can give your trade more high probabilities.
How to Read Candlestick ChartCandlestick Chart Patterns Explained |
Now, I am going to diagnosis a candlestick chart. It will be easy to understand this.

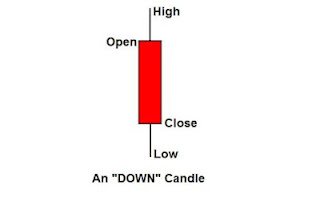
A candlestick usually has shadow and body. Look at the image above and check the text below.
- The green and red box are called as body.
- The wicks of the body is called as shadow.

- The upper wick of the body is called as upper shadow.
- The lower wick of the body is called as lower shadow.
- To understand bullish candle, traders usually use blue color.
- To understand bearish candle, traders usually use red color.
- You can set color as your wish from your charting software.
When a candle close higher than its open price is called as bullish or 'UP' candle.

When a candle close lower than it opening price is called as a bearish candle

- The upper shadow of a bullish candle indicates that buyer were able to take the price there but seller has down the price near the closing price.
- The lower shadow of a bullish candle indicates that seller were able to make down the price from opening but buyer has made up and even above the opening price. As a result it has closed as bullish candle.
- The lower shadow of a bearish candle indicates that seller were able to take the price down but buyers has made up the price near the closing price.
- The upper shadow of a bullish candle indicates that buyers were able to make up the price from opening but sellers get the power again. Consequently, Sellers has made down and even below the opening price. As a result it has closed as bearish candle.
Candlestick charting knowledge always helps a trader to know the surrounding atmosphere where the trader is! On the other hand, this charting system will help you to identify the strength of trend, support and resistance and so on.
No comments :
Post a Comment