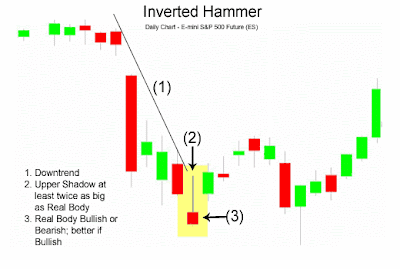
 The
inverted hammer candlestick chart pattern and shooting star look same.
The
inverted hammer candlestick chart pattern and shooting star look same.But the different is where they are. If you found this candlestick chart pattern in a up trend, then you've got a shooting star.
On the contrary, if you found this in a down trend, then you've got a inverted hammer candlestick pattern.
We will talk about shooting star later. We will now talk about inverted hammer.
Inverted hammer usually is found in a downtrend. Its long upper shadow indicates that buyer tried their efforts to up the price but seller has pushed their all efforts to down.
And Inverted hammer candlestick chart pattern's small real body indicates that the sellers can not back down the price more.
As a result price closed near the opening price of the period. At this time buyer push their efforts to up the price, but the seller lost their efforts already.
Because their are no seller at this present moments. Then who are now in the market ? definitely buyers.
Direction: Bearish or Downtrend
Type of This Pattern: Reversal
Reliability on This Pattern: Week
Now, notice our final lesion about this candlestick pattern.
If you found an inverted hammer candlestick chart pattern when you are looking to find out a potential trading signal from the chart, wait for a bullish candle after an inverted hammer candlestick pattern forming.
When you will see that a bullish candlestick has been formed, Then this trading signal has been confirmed.

Major Factors About Inverted Hammer Candlestick Chart Pattern...
1. Price in a nice downtrend.
2. Long upper shadow. It should be at least twice as big as real body.
3. Small real body. Here, it is bearish. But, better if it bullish.
4. Finally, This is a Inverted hammer candlestick chart pattern.


| 01 | How to Read A Candlestick Chart |
| 02 | Bearish Engulfing |
| 03 | Bullish Engulfing |
| 04 | Doji |
| 05 | Dragonfly Doji & Gravestone Doji |
| 06 | Piercing Pattern |
| 07 | Morning star |
| 08 | Dark cloud cover |
| 09 | Hammer |
| 10 | Hanging Man |
| 11 | Harami |
| 12 | Inverted Hammer |
| 13 | Evening star |
| 14 | Shooting star |
| 15 | Tweezers Top |
| 16 | Tweezers Bottom |
| 17 | Windows |
| 16 | The Last Discussion on Japanese Candlestick Chart |

No comments :
Post a Comment